Plots summarize the current filtered result. Select the plot type and number of categories to display.
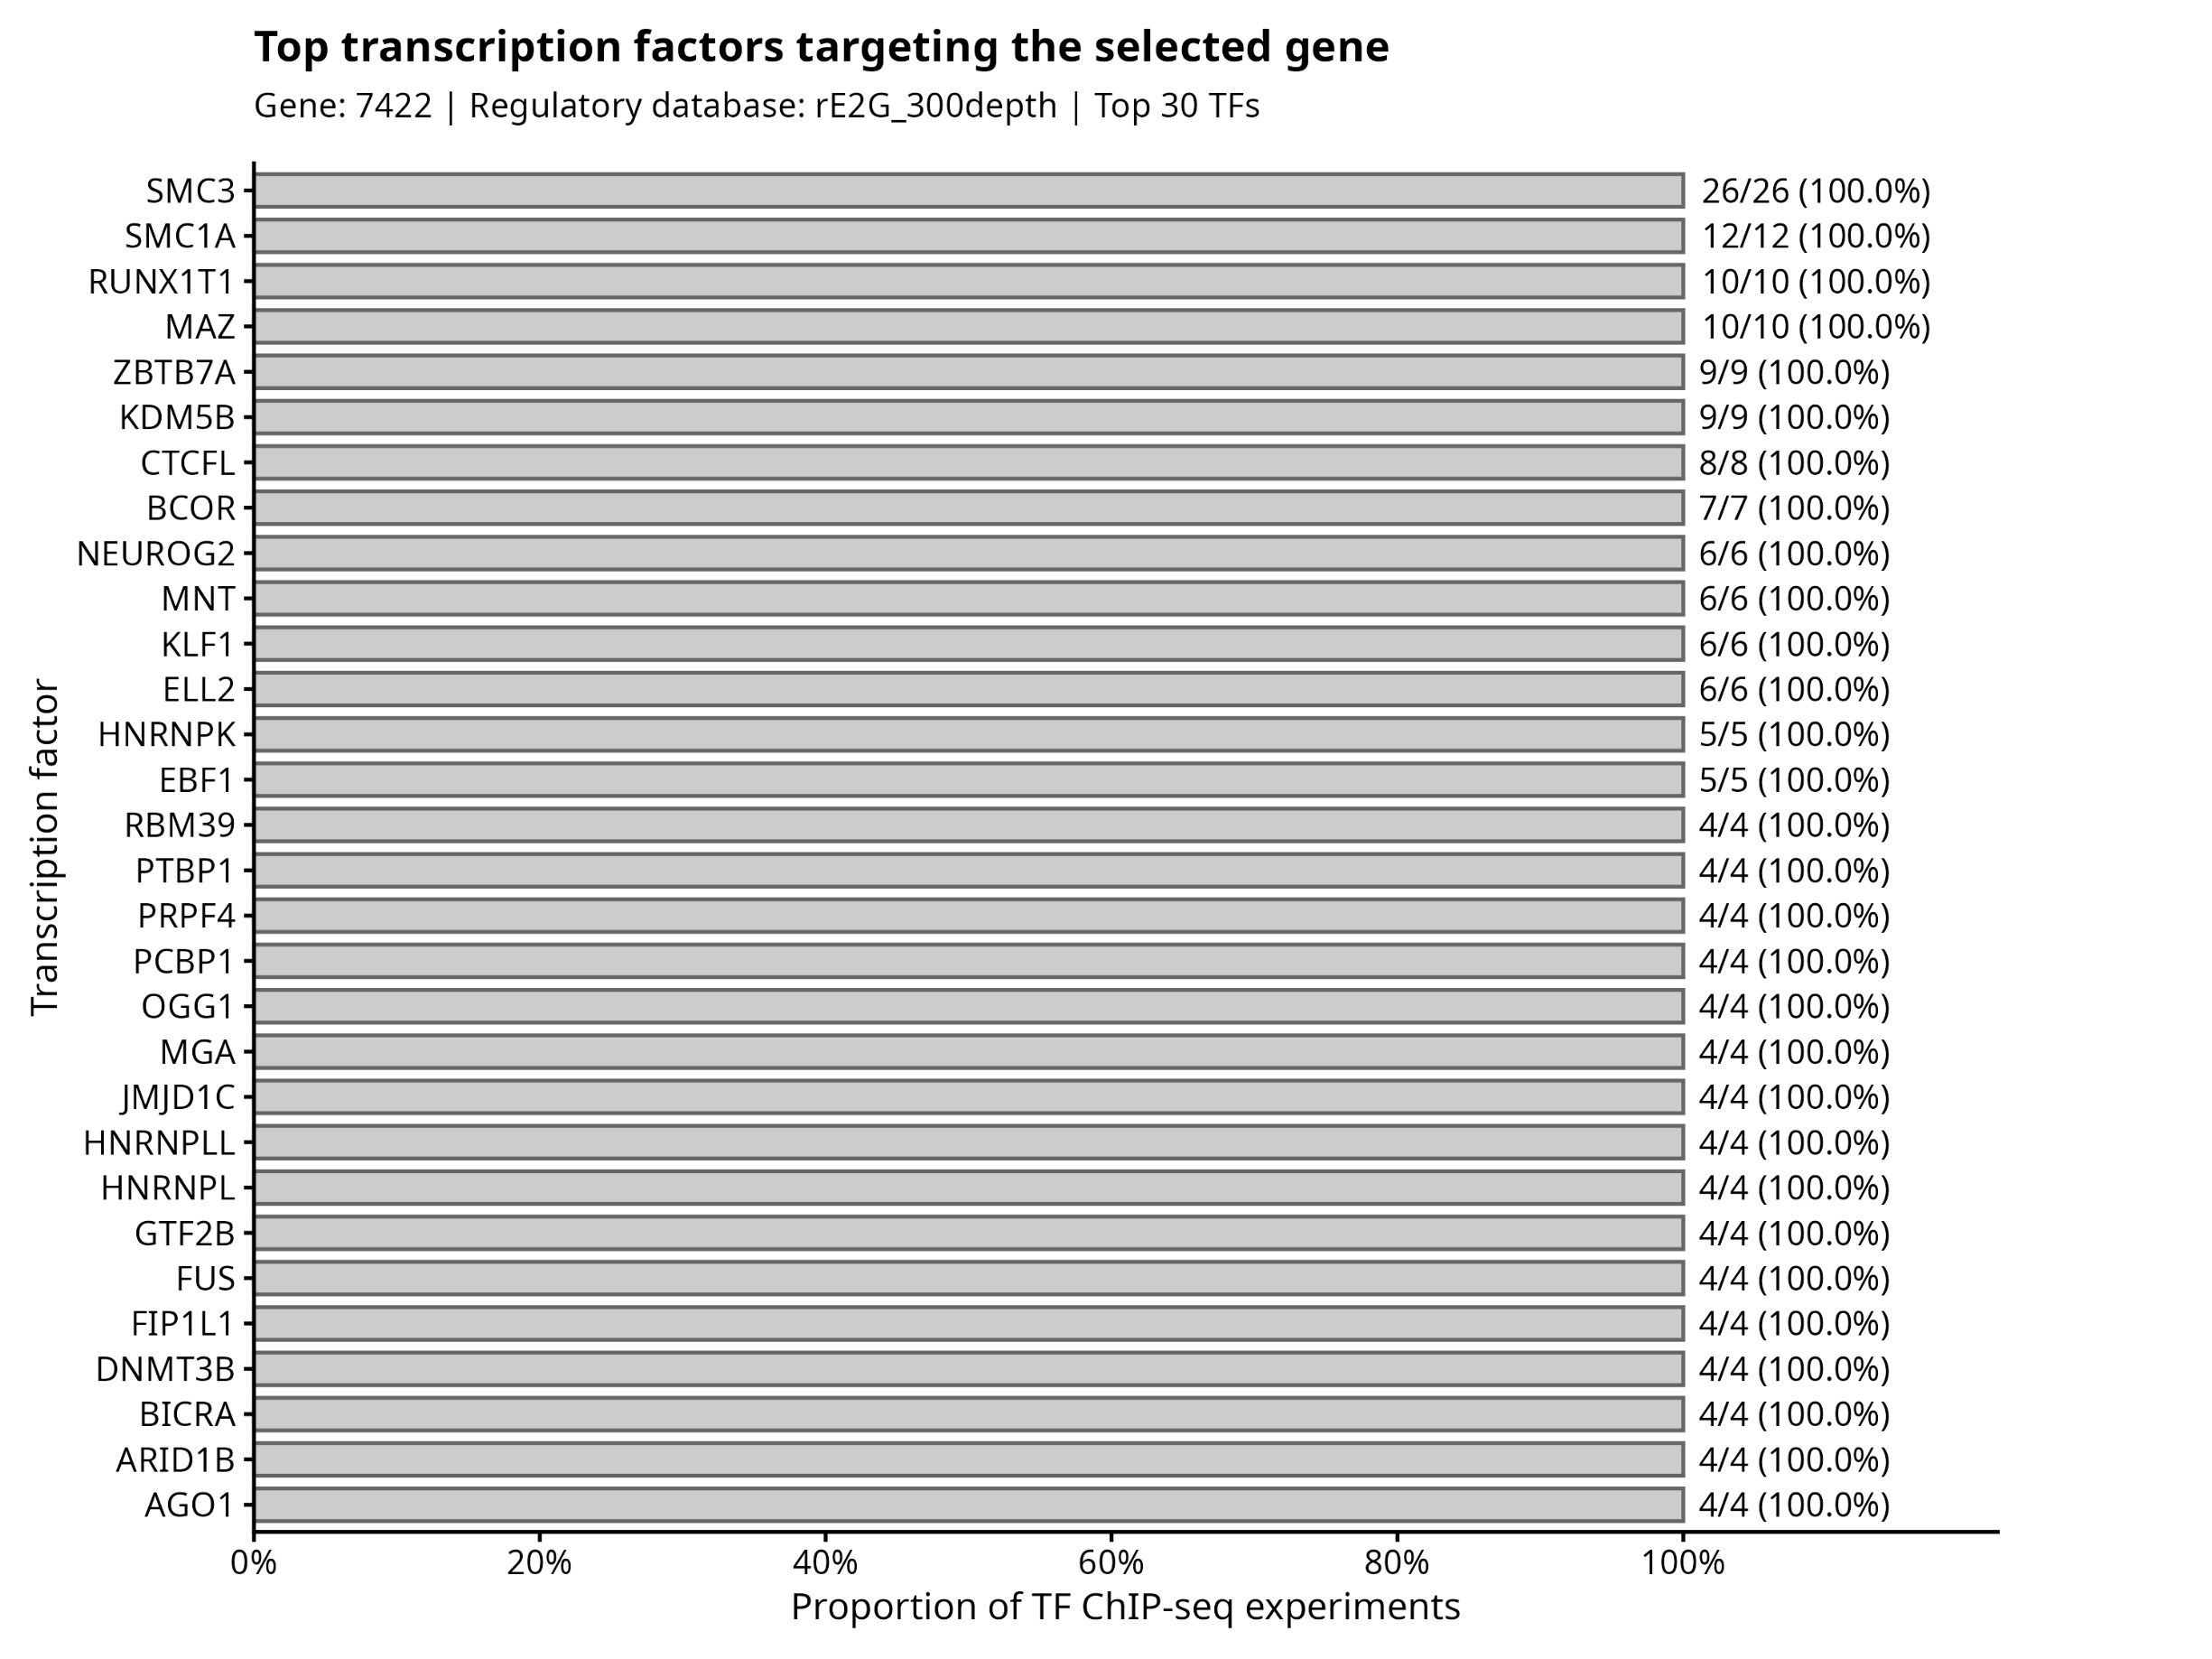
TFs are ranked by the proportion of their ChIP-seq experiments that identify the selected gene as a target.
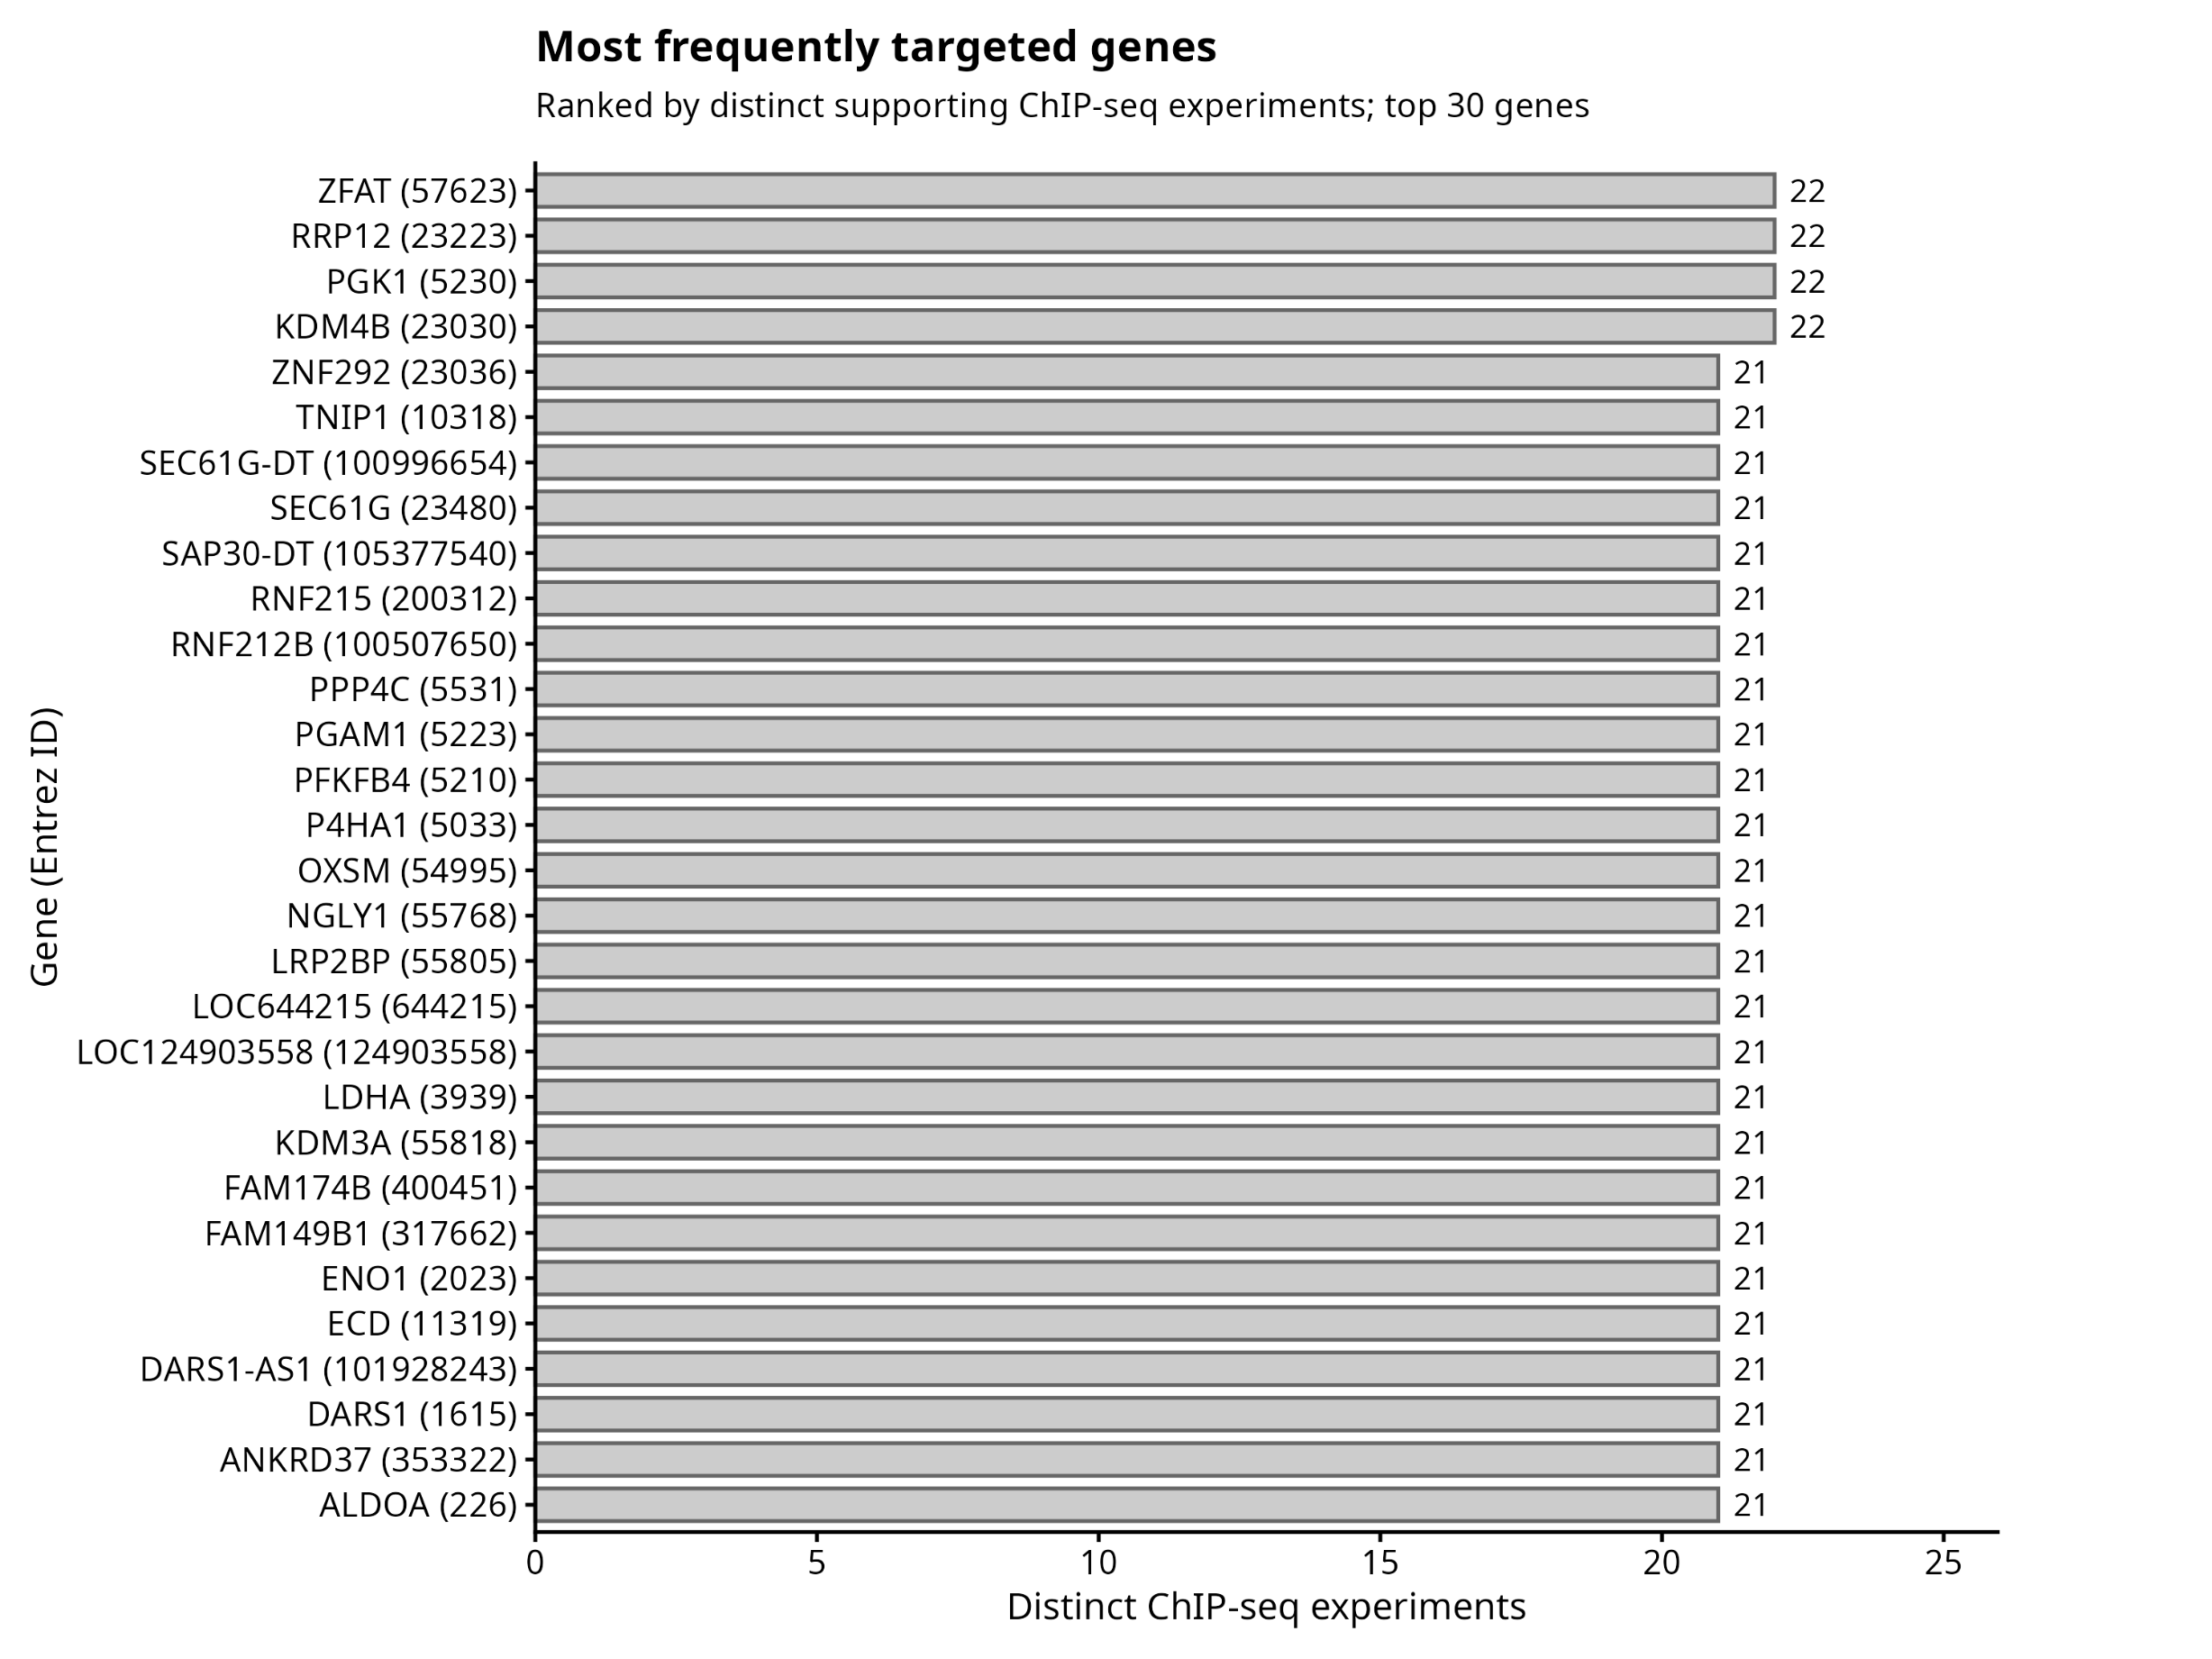
Genes are ranked by the number of distinct ChIP-seq experiments in the submitted query that identify them as targets.
Experiments are ranked by the number of distinct target genes retained by the submitted query.
Download summaries and unique identifiers from the complete filtered result, independently of the interactive table limit.
Example searches
The examples below illustrate common ways to explore the ChIPDBData resource. Each example presents the biological question, the corresponding filters and a representative output.
Example 1 — HIF1A target genes
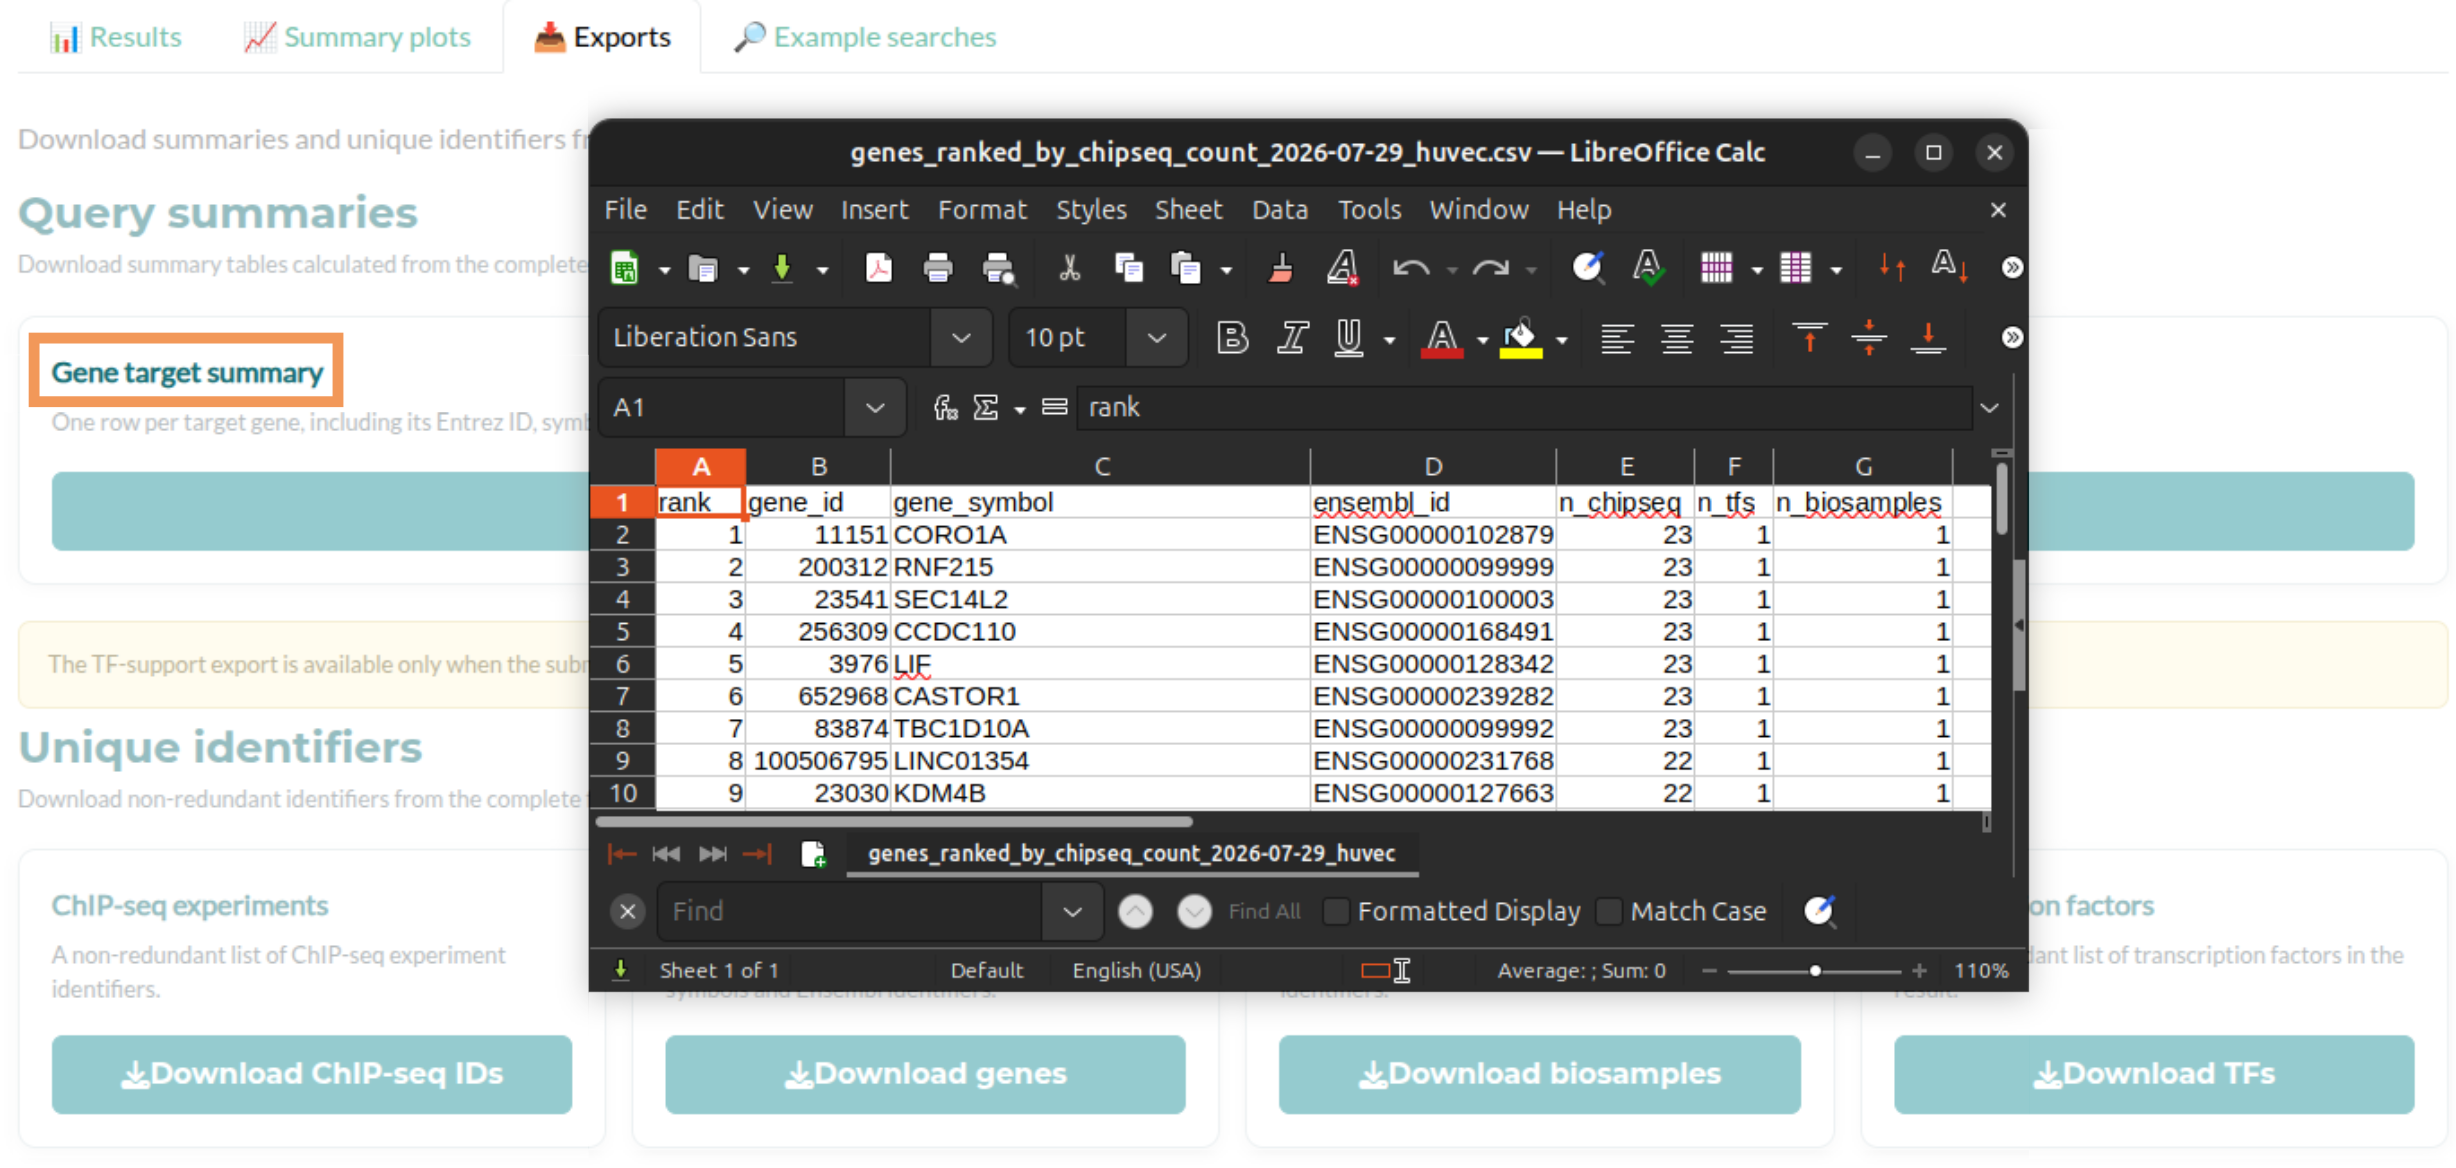
This example retrieves HIF1A–target associations using the generalized rE2G regulatory map in which regulatory interactions are retained when supported across at least 300 biosamples. The resulting table can be used to inspect individual associations, summarize ChIP-seq support and identify genes recurrently targeted across HIF1A experiments.
HIF1A
rE2G_300depth
Genes supported by multiple independent HIF1A ChIP-seq experiments appear near the top of the gene target summary.
Example 2 — Transcription factors targeting VEGFA
This gene-centred search retrieves all TF ChIP-seq experiments linked to VEGFA through rE2G_300depth regulatory interactions. It can be used to compare transcription factors, experiments and regulatory evidence associated with a gene of interest.
7422
— VEGFA
rE2G_300depth
Each row represents a ChIP-seq experiment whose binding regions are linked to VEGFA. The TF and experiment columns can be used to identify recurrent regulators and examine the diversity of supporting experiments.
Example 3 — Targets from one ChIP-seq experiment
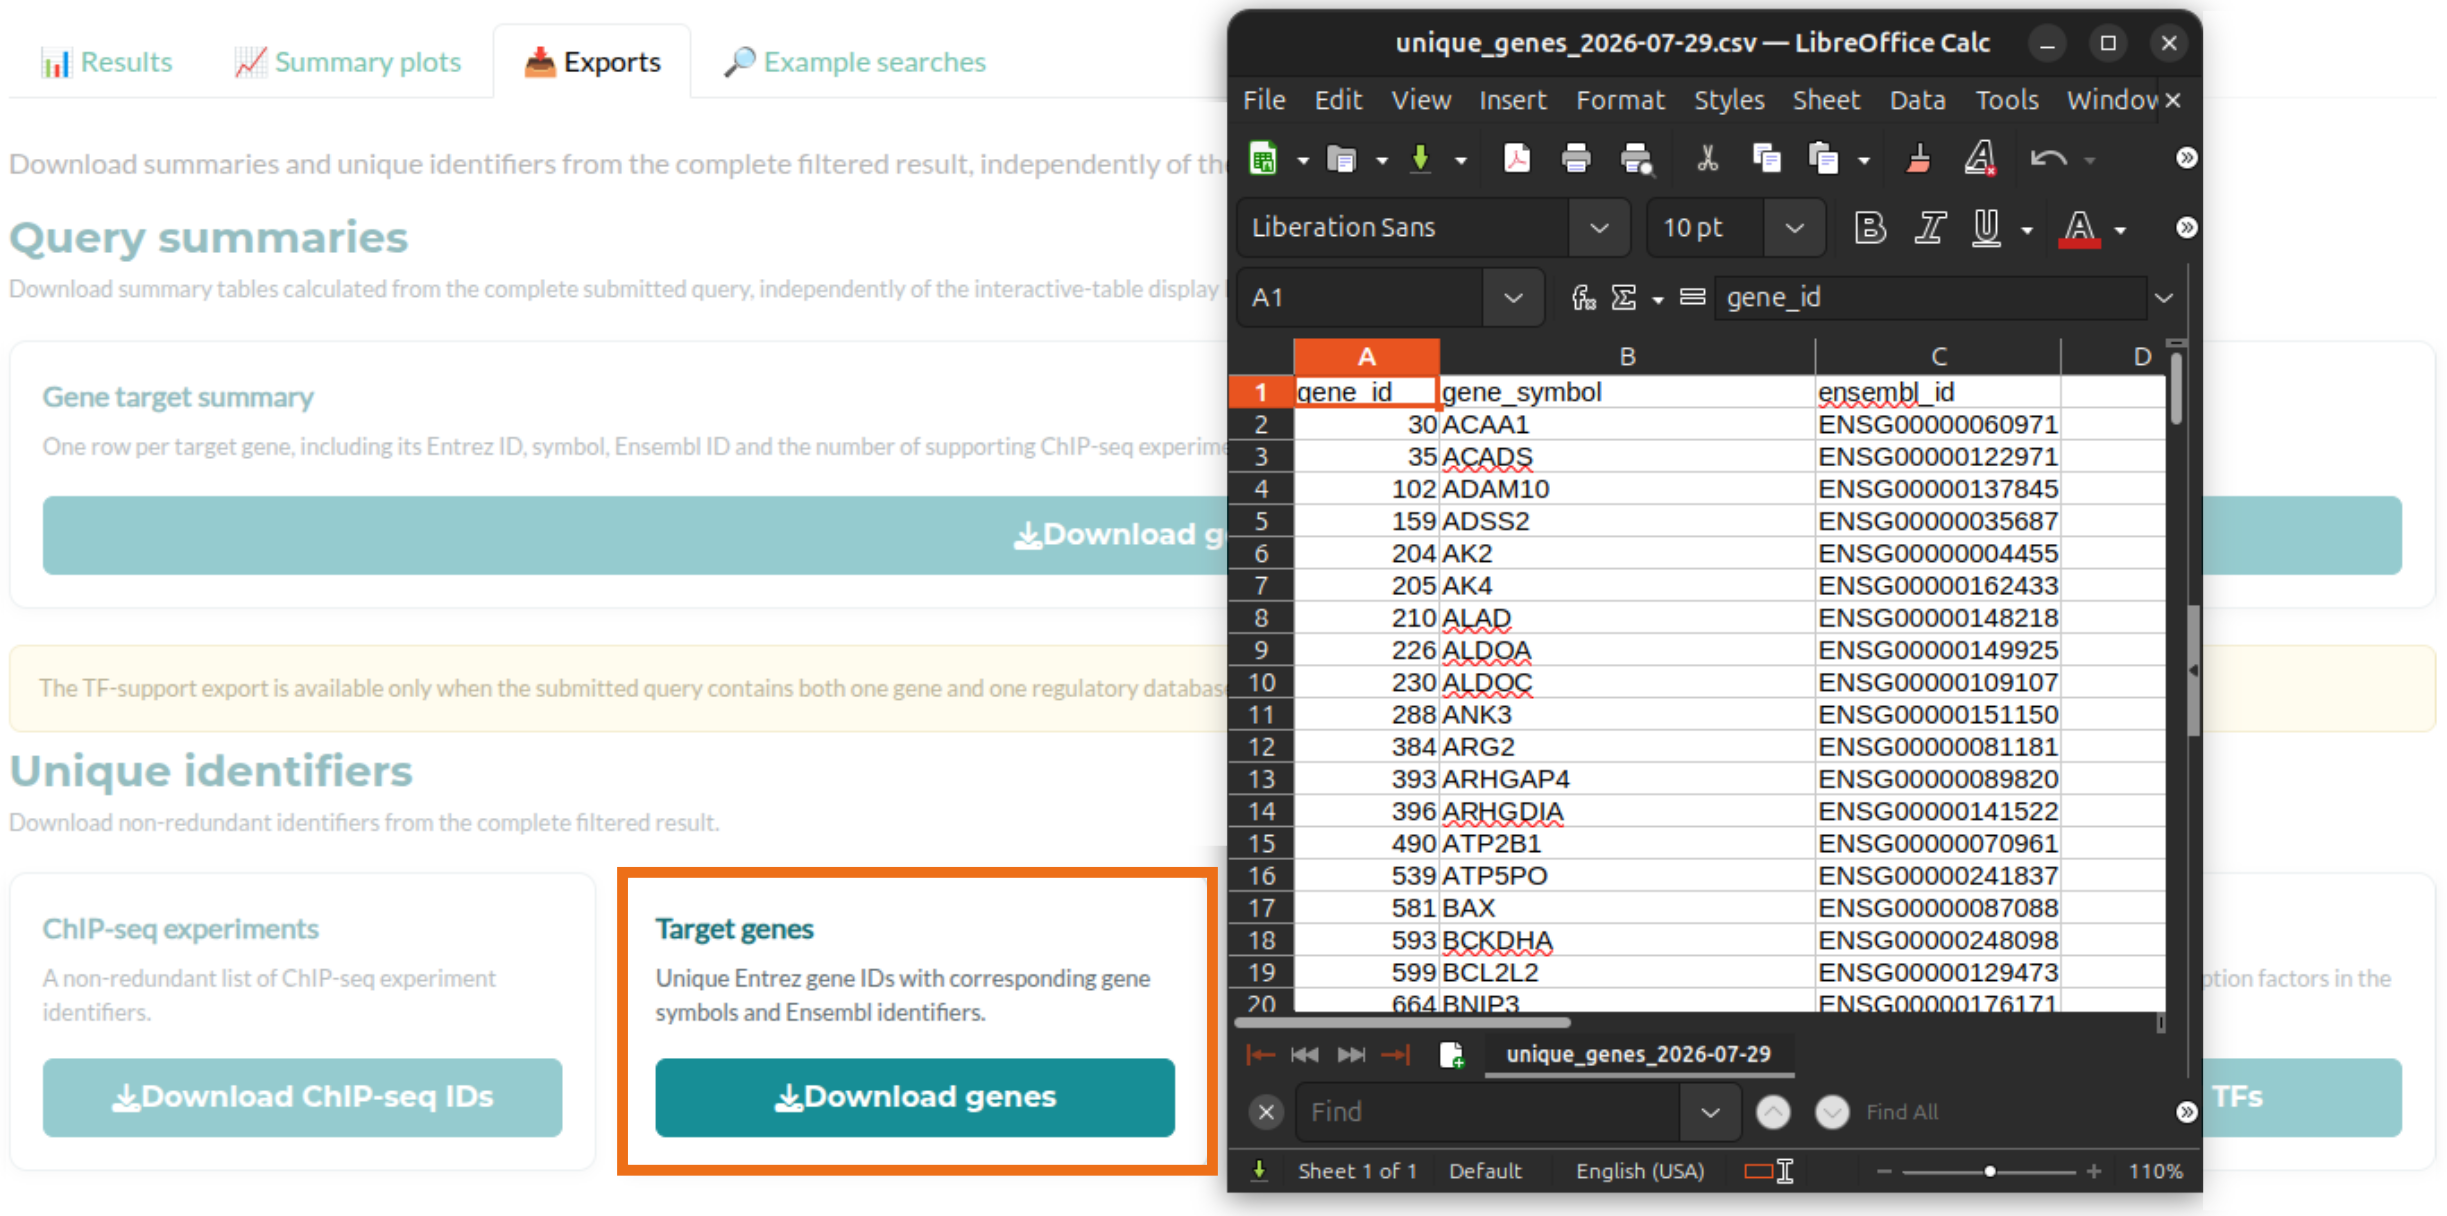
An experiment-centred query retrieves the complete set of predicted target genes for one ChIP-seq dataset. This is useful for inspecting the regulatory output of an individual experiment or comparing its target set across regulatory maps.
GSE39089.HIF1A.HUVEC-C_HYPOX
rE2G_300depth
The output contains one row per inferred experiment–gene association. The unique-gene export provides a non-redundant target list with gene symbols and Ensembl identifiers.
Example 4 — Cell type-specific regulatory associations
Cell type-specific rE2G maps can be used to restrict the inferred TF targets to regulatory interactions identified in a selected biosample. This enables the comparison of context-specific regulatory relationships.
endothelial_cell_of_umbilical_vein_ENCFF586TYO
HIF1A
The results represent associations supported by the regulatory map of the selected biosample. Differences between biosamples may reflect context-specific enhancer–gene relationships.